🧭 Interactive Exploration
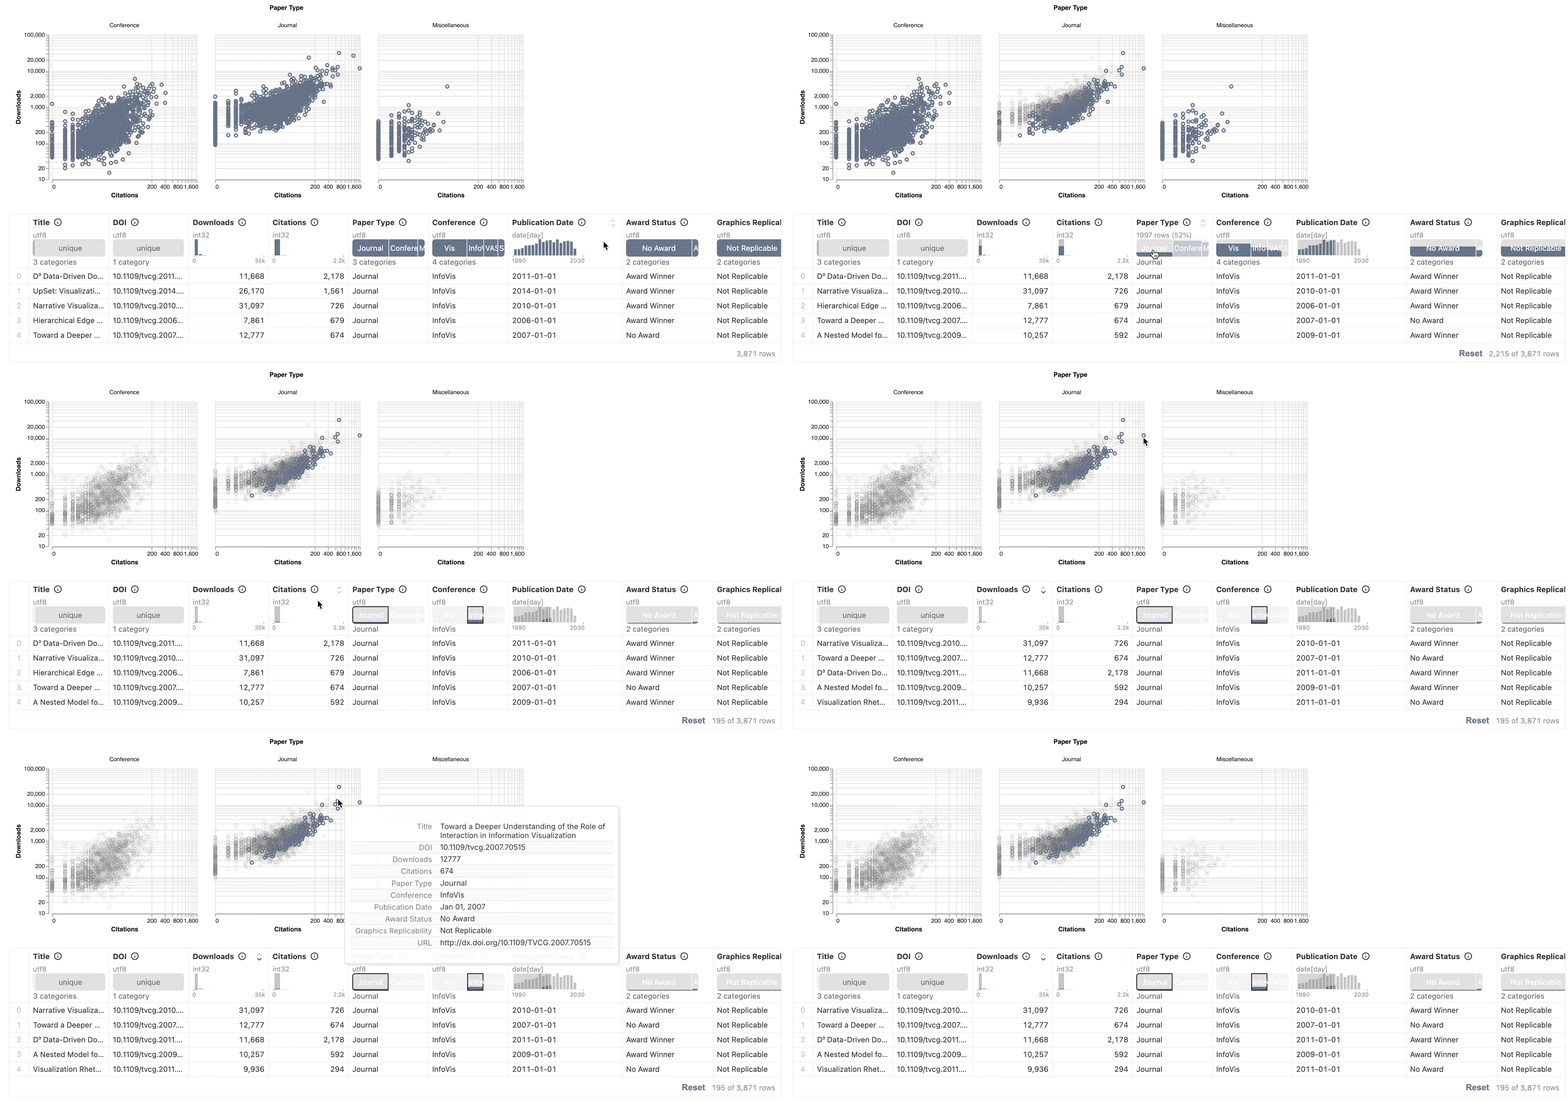
While AI-generated visualizations provide valuable starting points, the most compelling insights often emerge when readers can explore beyond the initial narrative. Consider the faceted scatterplot below, which visualizes downloads against citations across different paper types—already a meaningful analysis. But what happens when a reader becomes curious about a more specific relationship, such as the pattern among award-winning journal papers published specifically at InfoVis before 2012?
Such nuanced questions are highly difficult to be sustainably anticipated by AI systems, no matter how sophisticated. More importantly, readers often discover these exploration-worthy relationships only through direct engagement with the data itself.
This is where Mosaic transforms static reports into dynamic exploration environments. Our Vega-Lite visualizations, generated from Draco specifications, become interactive Mosaic clients connected to Quak data tables. This integration empowers readers to perform highly specific cross-filtering, sorting, and data interactions—turning every report into a personalized analytical journey.

💡 Power of Reader-Driven Exploration
Watch how effortless exploration becomes: with just a few clicks and brushes, readers can drill down from the full dataset of 3,871 papers to precisely the 195 papers that match their specific research interest—all in real-time, without any coding or complex queries.