Simulating an epidemic
examples/epidemic.py simulates two hundred people in a city, after 3Blue1Brown's Simulating an epidemic. Each person wanders, infects susceptible neighbours within an infection radius, and recovers after five days. A slider sets the share of people who keep their distance from their nearest neighbours. The Animation view plays the city beside the stacked shares of susceptible, infectious, and recovered people, then ends on the notebook's comparison of every distancing level.
Pause the movie and point at any person. The movie knows which row of the notebook's people table each dot shows, and which line of scene.py drew it.
Open the notebook and its view in Studio from a clone of the repository:
pixi run edit epidemicThe notebook simulates, the scene choreographs
The notebook's simulate() runs the city in steps of a twentieth of a day with NumPy. People drift toward a gravity well that moves every day, bounce off the walls, and cap their speed, as in 3Blue1Brown's SIRSimulation. It returns three results the scene reads:
| Value | Holds |
|---|---|
people | One record per person: the day they were infected, recovered, and by whom |
paths | Each person's position twice a day, as x0, y0, x1, y1, … |
history | The shares of susceptible, infectious, and recovered people over time |
The scene draws a dot per person, moves the dots along a curve through the recorded positions, pulses a ring out to the infection radius around each infectious person, and links each new case to the person who infected them for a day. It recomputes none of the epidemic.
| Share keeping their distance | Peak infectious | Ever infected |
|---|---|---|
| 0% | 56% on day 10.5 | 93% |
| 25% | 48% on day 10 | 80% |
| 50% | 25% on day 12 | 49% |
| 75% | 10% on day 8.5 | 23% |
The table counts infections over the 24 simulated days. At 75%, a few people are still infectious on the last day.
Trace a person
Every shape the scene's code creates records the notebook results it shows. Each dot is created from its row of people:
for k, person in enumerate(people):
    dot = Dot(start[k], radius=0.06, fill_color=PALETTE[status_on(person, 0)])
    crowd.add(dot)
so the dot of the eighteenth person traces to people[17], and through it to the notebook cell simulation. The city holds still on patient zero, at the peak, and at the end, and a reader who pauses there finds every person exactly. While people move, each person's target covers a short stretch of their path. Each ring traces to the infection_radius it pulses out to, the city_size that scales it, and the people whose infection times it follows. The peak marker traces to summary.peak_day, and the final chart to flattening_figure. In Studio's preview, Lens selects the same shapes and hands them to a coding agent. Every outline below is a traced shape at the peak, each one a target:
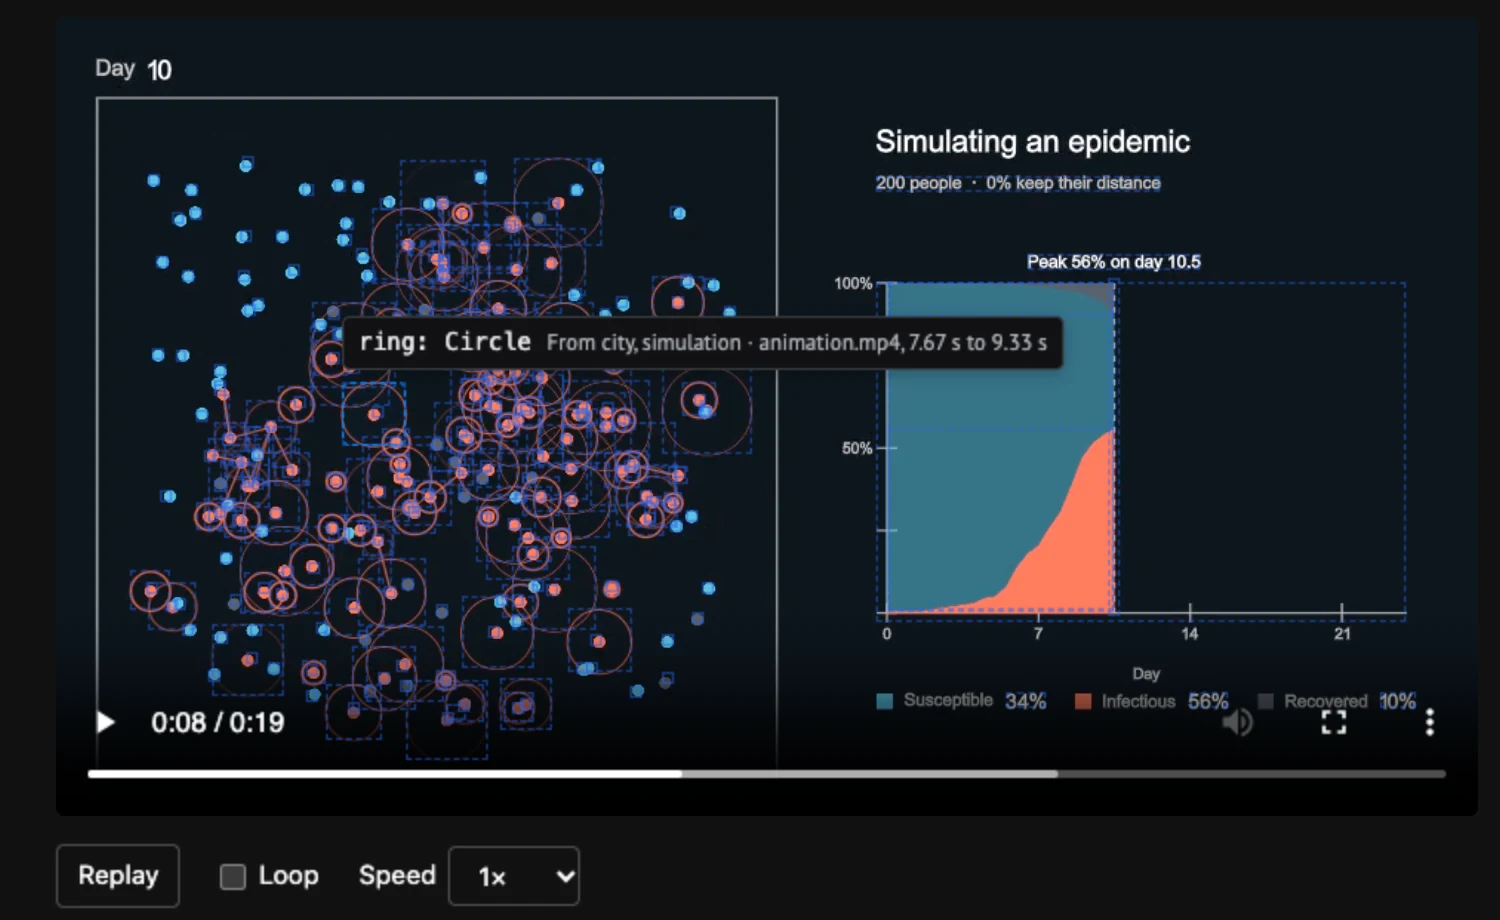
Traced shapes describes how the tracer follows reads.
Static export
The view's states.yaml prepares every value of the distancing slider. A zero-python export renders one movie per value, and the exported page swaps movies as the reader moves the slider. The Exported page link under the movie opens this export:
pixi run marimo-studio view export animation --target examples/epidemic.py \
  --output dist/epidemic --runtime zero-python
A static export stores every state's values. The notebook records positions twice a day, and the scene draws Catmull-Rom curves between them, so the four states fit the export's budget of values.
scene.py adapts SIRSimulation and SIRGraph from 3b1b/videos and shares their CC BY-NC-SA 4.0 license.